On this page
The Challenge: A Mountain of Raw Data
In modern business, data is everywhere, but clarity is rare. Imagine receiving a sprawling spreadsheet containing thousands of rows of unorganized sales transactions, dates, regions, and product categories. For most professionals, manually sorting, filtering, and calculating this data to find meaningful insights feels like searching for a needle in a haystack.
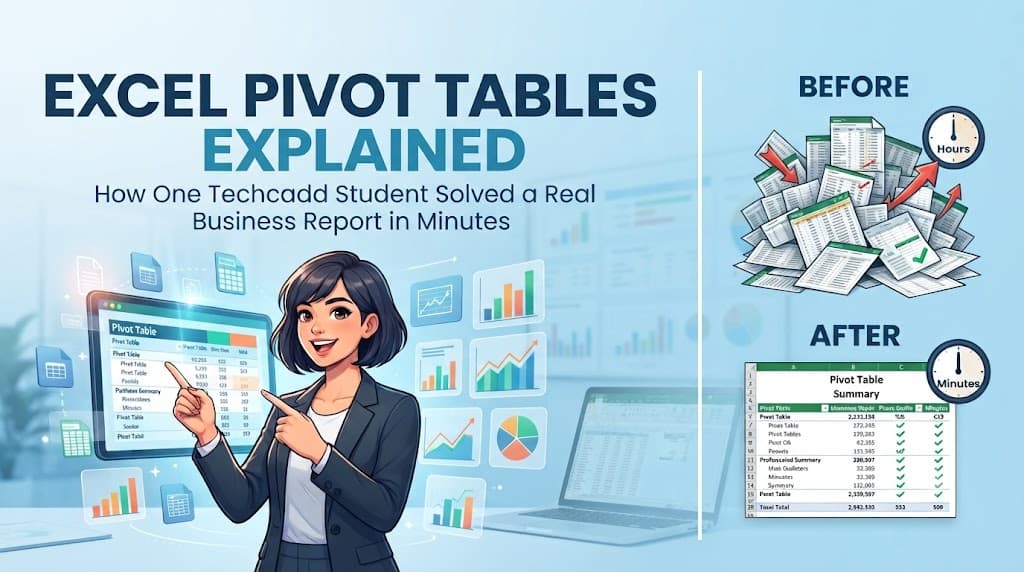
When a local retail client approached a Techcadd student with a massive backlog of unformatted sales data and a tight deadline, the clock was ticking. The goal was simple yet demanding: extract regional performance metrics, identify top-selling products, and present a clean summary—all before the end of the business hour.
The Solution: The Magic of Excel Pivot Tables
Instead of getting bogged down in complex formulas or tedious manual counting, the student turned to one of Excel’s most powerful yet underutilized features: Pivot Tables.
With just a few clicks, the student was able to:
Summarize Massive Datasets instantly: Group millions of rows of data by category, month, or region without writing a single complex formula.
Slice and Dice Data Dynamically: Use drag-and-drop fields to view sales figures from multiple angles, instantly shifting focus from regional performance to individual product profitability.
Visualize Trends Effortlessly: Pair the Pivot Table with a PivotChart to give stakeholders a crystal-clear visual breakdown of financial growth and seasonal trends.
The Results
What normally took the company’s internal team hours of manual spreadsheet wrangling was completed by the Techcadd student in under ten minutes. The resulting report was accurate, dynamic, and easy for executives to digest, ultimately securing high praise for the student's problem-solving efficiency.
Why Mastering Pivot Tables Matters
This real-world success story highlights a crucial truth: technical skills are only as good as their practical application. At Techcadd, students don't just learn theory out of a textbook; they tackle authentic business challenges that bridge the gap between classroom learning and workplace success.
Mastering tools like Pivot Tables transforms you from a data entry clerk into a strategic decision-maker. Whether you are aiming to streamline your current workflow or break into the tech and data analytics industry, understanding how to quickly turn raw numbers into actionable insights is an invaluable superpower.
Are you looking to master advanced Excel techniques and real-world data tools to supercharge your career?
Filed under
Keep reading
- Master the Top 5 Excel Formulas Every Office Worker Needs Daily | TechCADD Hands-On WorkshopExcerpt Stop wasting hours on manual data entry. Discover the 5 essential Excel formulas every professional relies on daily and learn how to apply them step-by-step with hands-on training at TechCADD.
- Why Basic Computer Skills Are Still the First Step to Every Tech Career — A TechCADD Student GuideLearn why basic computer skills remain essential for every technology career and discover how TechCADD helps students build a strong foundation for advanced digital and technical skills.
- AI and Data Analytics: Jobs & Career Scope in Jalandhar 2026–2027For students in Jalandhar, AI and Data Analytics can provide opportunities to develop practical technology skills through projects, internships, certifications, and industry-focused training. The field offers career paths for both technical and business-oriented learners, with opportunities across.
Comments
Loading…