Best After 12th 4-Month Data Analytics Program in Jalandhar
A four-month fast-track path into modern analytics — Python and SQL, advanced Excel, Power BI and Tableau, business analysis, modern data platforms and generative AI productivity, ending in one portfolio-ready enterprise capstone.
Data Analytics Program Course in Jalandhar
A 4-month fast-track Data Analytics & Business Analysis programme for school leavers at techcadd Jalandhar (4.9★, 556+ reviews): Python, advanced SQL and Excel, Pandas and NumPy, Power BI, DAX and Tableau, Microsoft Fabric and Snowflake, BRD/FRD and Agile with Jira, plus generative AI productivity — 16 modules and one enterprise capstone. Fresher analyst roles start around ₹16,000 – ₹28,000.
Key Highlights :
- Duration: 4 Months
- Mode: Classroom & 1-on-1
- Eligibility: 12th Pass
- Includes: Placement Support
Course Overview
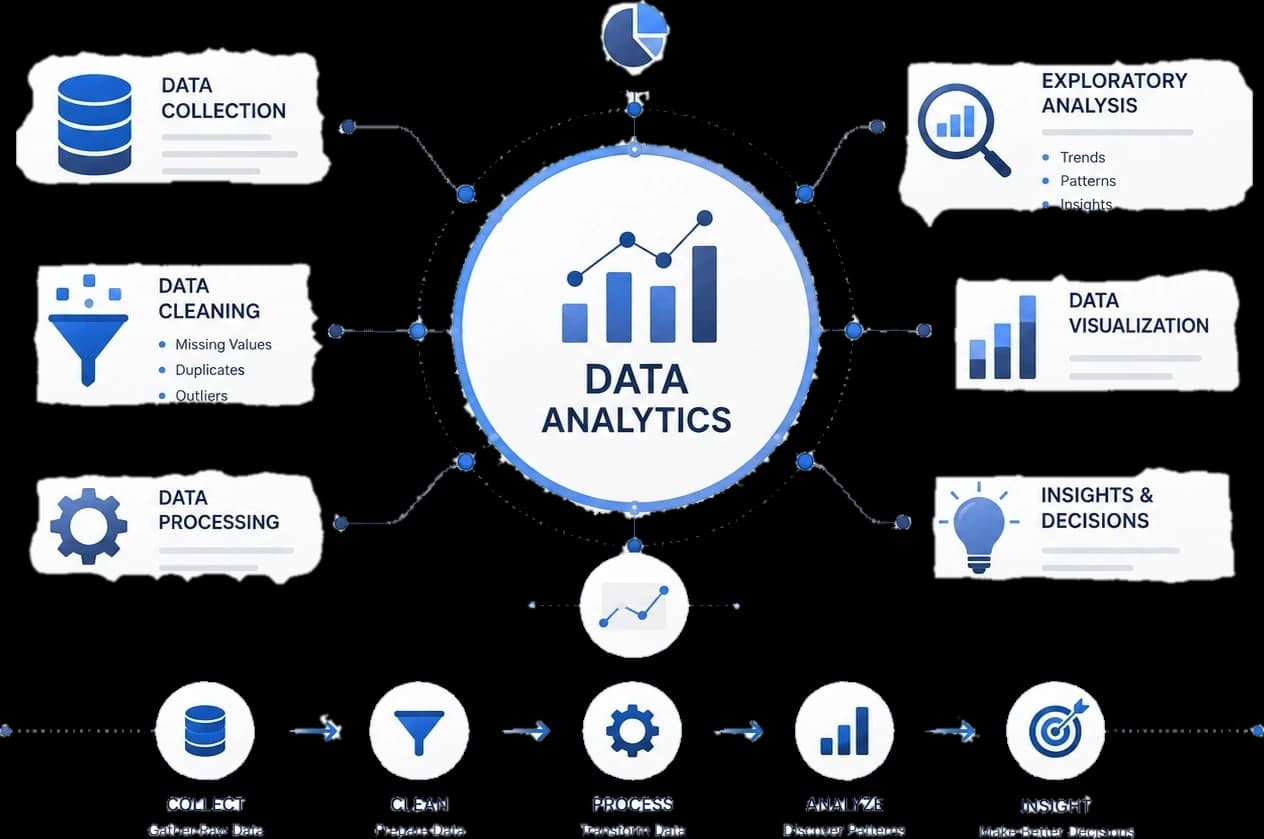
This is the Data Analytics & Business Analysis Mastery Program on its four-month fast track, written for someone starting straight after 12th. Sixteen modules across four months, ending in one complete, portfolio-ready enterprise analytics solution. It covers Python for data analytics, SQL, advanced Excel, Power BI, Tableau, business analysis and generative AI productivity for analysts — the whole job rather than one tool.
Month one is programming and data analytics foundations: the analytics lifecycle from descriptive through prescriptive, Python setup with VS Code and Git/GitHub, and the AI productivity tools you will use throughout — ChatGPT, GitHub Copilot and Gemini. Then advanced Excel for analysts with data cleaning, pivot tables and charts, XLOOKUP, INDEX-MATCH, Power Query basics and interactive dashboard design; SQL fundamentals covering database concepts, tables, primary and foreign keys, SELECT, WHERE, GROUP BY, HAVING, aggregate functions and basic joins; and Python fundamentals with variables, loops, functions, OOP basics and exception handling, alongside business statistics — mean, median, standard deviation, correlation, probability and outliers.
Month two is advanced SQL, data manipulation and visualisation — INNER, LEFT and RIGHT joins, CTEs, subqueries, window functions, views, query optimisation and enterprise reporting; data wrangling with NumPy arrays and Pandas DataFrames, CSV and Excel ingestion, filtering, missing value handling, GroupBy, merging and feature engineering; exploratory data analysis with Matplotlib, Seaborn and Plotly interactive charts for business trend analysis; then REST APIs, JSON, BeautifulSoup web scraping and Streamlit for building interactive analytics apps.
Month three is business intelligence and modern data platforms: Power BI Desktop with data ingestion, Power Query transformation, star and snowflake schemas and fact and dimension tables; advanced DAX with calculated columns, measures, time intelligence, running totals, executive KPI cards and dynamic reporting; Tableau with calculated fields, parameters, interactive dashboards, map visuals and storytelling best practices; and modern data platforms covering data warehouse versus data lake, Microsoft Fabric, a Snowflake overview, ETL and ELT concepts, dbt basics and API integration. Month four closes the programme with business analysis and requirements engineering, Agile methodologies and project management, generative AI and productivity automation, then the professional portfolio and industry capstone — an end-to-end enterprise analytics solution covering requirement gathering as a BRD, SQL database querying, Python EDA, Power BI dashboards and AI-assisted executive presentations, with GitHub documentation, an ATS resume, LinkedIn optimisation and mock interviews.
What You'll Learn
Every module ends in something you have built and a trainer has reviewed, so the list below is work you will have done rather than topics you will have heard about.
- 01
Interactive Excel dashboards, early
Data cleaning, pivot tables and charts, XLOOKUP, INDEX-MATCH and Power Query producing dashboards a manager can use — the part of month one that is employable on its own.
- 02
SQL to enterprise depth
Not just SELECT and JOIN: CTEs, subqueries, window functions, views and query optimisation for enterprise reporting — the round that decides most analyst interviews.
- 03
Power BI and Tableau, both
A star-schema model with advanced DAX time intelligence and executive KPI cards, and a Tableau story with parameters, calculated fields and map visuals.
- 04
An enterprise capstone
Requirement gathering as a BRD, SQL database querying, Python EDA, Power BI dashboards and AI-assisted executive presentations — documented on GitHub for your portfolio.
Course Curriculum
The syllabus is 16 modules across four months, ending in one enterprise capstone. Month 1 builds the programming and analytics foundations, month 2 is advanced SQL, data manipulation and visualisation, month 3 is business intelligence and modern data platforms, and month 4 is business analysis, AI productivity and the capstone.
Month 1 — Programming & Data Analytics Foundations
- 1
Module 01 · Data Analytics & AI Productivity Tools — data analytics lifecycle, descriptive to prescriptive analytics, Python setup, VS Code, Git/GitHub, ChatGPT, GitHub Copilot, Gemini
- 2
Module 02 · Advanced Excel for Analysts — data cleaning, pivot tables, pivot charts, XLOOKUP, INDEX-MATCH, Power Query basics, interactive dashboard design
- 3
Module 03 · SQL Fundamentals — database concepts, tables, primary and foreign keys, SELECT, WHERE, GROUP BY, HAVING, aggregate functions, basic joins
- 4
Module 04 · Python Fundamentals & Business Statistics — variables, loops, functions, OOP basics, exception handling, mean, median, standard deviation, correlation, probability, outliers
Tools you will actually work in
Everything here is installed on the lab machines and used on live client work, not shown once in a slide and forgotten.
- BSMEBIMASEBERAJSTbBFCOASMFDBGPTGGVS
Who can do this course
Students straight out of 12th
Any stream. Module 01 is the analytics lifecycle and setting up your tools; module 02 is Excel, which most students have seen before. Python arrives once you know what you are automating.
Commerce and B.Com students
This is the closest technical track to a commerce background. Finance, sales and HR reporting run through every month, and the business analysis half is written in the language of requirements and process rather than of algorithms.
Students with a term to spare
Four months fits a long vacation or the gap between school and college, and you finish it with an enterprise capstone on GitHub rather than an unfinished playlist.
Anyone aiming at an office analyst role
MIS Executive and Reporting Analyst are the roles Jalandhar firms hire for most often, and they are decided on Excel, SQL and Power BI — all three are covered to enterprise depth here, not as an introduction.
Career switchers and entrepreneurs
Weekend batches exist for people already working. Owners take this to stop guessing at their own numbers; switchers take it because analytics is the widest office-side entry point into IT work in Punjab.
Self-taught learners
If tutorials left you able to follow along but not to start from a blank file, what changes here is a trainer reviewing your work each week and a capstone with a deadline attached.
Why this programme is worth your year
Python for analytics
Python fundamentals, Pandas, NumPy and automation built for modern data analysis — variables, loops, functions, OOP basics and exception handling, then real data wrangling.
Advanced SQL and Excel
Enterprise querying with joins, CTEs, subqueries, window functions, views and query optimisation, plus Power Query, DAX and complex formulas.
Business intelligence
Interactive dashboard building and storytelling in Power BI and Tableau — star and snowflake schemas, DAX time intelligence, KPI cards, map visuals and parameters.
Business analysis
Requirement gathering, BRD and FRD creation, SRS documentation, Agile and Scrum, user stories, acceptance criteria, sprint planning, Jira and Confluence.
Modern data platforms
Data warehousing fundamentals, Microsoft Fabric, a Snowflake overview, ETL and ELT workflows, dbt basics and API integration.
AI productivity and a capstone
Prompt engineering with ChatGPT, GitHub Copilot and Gemini for automated reporting — then one complete, portfolio-ready enterprise analytics solution.
The Whole Analyst Job, in Four Months
- 16 modules from Excel and SQL through Power BI, Tableau, BRD/FRD and generative AI — ending in one portfolio-ready enterprise analytics solution.
- Fresher Data Analyst, MIS and Reporting Analyst roles in Punjab start around ₹16,000 – ₹28,000 a month for someone with dashboards they can show.
Get certified in Data Analytics Program
Complete the course with a portfolio of live projects and receive an industry-recognised certificate, plus a documented internship letter accepted by Punjab universities.
 Computer Education · JalandharCertificateof Project ExcellenceThis is to certify thatStudent Name
has designed, built and deployed a live capstone project in Data Analytics Program, reviewed and graded under industry mentorship.
Computer Education · JalandharCertificateof Course CompletionThis is to certify thatStudent Namehas successfully completed the professional training programme in Data Analytics Program with a grade of A+.
Two certificates on completion — the course certificate and a separate capstone project certificate.
Where this course takes you
The roles this opens, what they pay in Punjab and beyond, and who is hiring for them — the same figures our free Salary Estimator publishes, not a brochure number.
Conduct end-to-end business data analysis from raw data ingestion to executive delivery; write complex SQL queries using window functions, CTEs and joins; clean, transform and analyse datasets using Python, Pandas and NumPy; design dynamic, interactive dashboards in Power BI and Tableau; apply business analysis methodologies including BRD creation and Agile user stories; automate analytics workflows using generative AI tools; and build and deploy a capstone business analytics project with a GitHub portfolio.
Data Analyst, Business Analyst, BI Developer, Reporting Analyst, Analytics Engineer, Product Analyst, Marketing or Financial Analyst and AI-Powered Data Analyst. Straight after 12th, MIS Executive and Reporting Analyst are usually the first step, with Business Analyst opening once you have shipped requirements work.
A fresher with a portfolio of dashboards typically starts around ₹16,000 – ₹28,000 a month in the Jalandhar market. That rises quickly with experience, and analysts who add the business analyst title or the Fabric and Snowflake platform skills move well beyond it.
Take this fast track if you want the whole analyst job covered inside a single term and a bit, or have a fixed window. Take the six-month certificate if you want more room: a lab every week, six mini projects rather than one capstone, business statistics as its own week, BPMN process mapping, Apache Airflow, machine learning for analysts and a dedicated placement month.
No. The business statistics you need — mean, median, standard deviation, correlation, probability and outliers — are taught in module 04 at exactly the depth reporting work requires. Commerce and arts students are among the strongest candidates on this track.
Yes. Dashboard builds, Excel and SQL reporting automation and one-off analyses are common independent work, and a Jalandhar address costs you nothing on a remote brief. The Streamlit and GitHub work is what lets you hand a client something they can open rather than a file you have to explain.
Hands-on projects you will ship
Interactive Excel Dashboard
Month one's build: a cleaned dataset turned into pivot tables and charts with XLOOKUP and INDEX-MATCH lookups and a Power Query refresh, designed as a dashboard someone actually uses.
Enterprise SQL Reporting
Customer, orders and product data queried with joins, CTEs, subqueries and window functions, delivered through views and tuned with query optimisation.
EDA & Business Trend Analysis
A messy dataset cleaned and engineered in Pandas and NumPy, outliers detected, then explored with Matplotlib, Seaborn and interactive Plotly charts.
Interactive Analytics App
Data pulled from REST APIs and scraped with BeautifulSoup, then delivered as a Streamlit app someone can open and filter for themselves.
Executive BI Dashboard
A star-schema Power BI model with advanced DAX measures, time intelligence and executive KPI cards, rebuilt as a Tableau story with parameters and map visuals.
Enterprise Analytics Capstone
The full solution: requirement gathering as a BRD, SQL database querying, Python EDA, Power BI dashboards and an AI-assisted executive presentation, documented on GitHub. This is the one interviewers ask about.
Learn it. Build it. Make it yours.
Every project moves through the same loop: understand the brief, build with guidance, then explain the decisions behind your work.
Understand
Break a real requirement into a clear plan and the right tools.
Interactive Excel DashboardBuild
Work hands-on with trainer feedback while the decisions are still easy to change.
Enterprise SQL ReportingPresent
Turn the finished work into a portfolio story you can defend in an interview.
EDA & Business Trend AnalysisWhy students choose techcadd
There are many places to learn analytics in Jalandhar and the brochure syllabus looks similar at all of them. What differs is who teaches, whether you ever build against a real business question, whether the business analysis half is genuinely taught, and whether anyone picks up the phone after you have paid. techcadd has trained students across Punjab since 2007 on the same model: small batches, working practitioners as trainers, live client work as coursework.
Trainers who still do the work
Your trainer is not a full-time lecturer. They deliver reporting and analytics work for techcadd's services arm, so the dashboards in class come from real business questions rather than a sample dataset.
Written for a school leaver
Module 01 starts at the analytics lifecycle and tool setup. Excel comes before SQL, SQL before Python, and nothing is skipped on the assumption you will pick it up later.
Analyst and business analyst in one programme
Month four carries requirement gathering, BRD and FRD writing and Agile in Jira — the half of the job most fast-track analytics courses leave out entirely.
Both BI tools, not just one
Power BI with Power Query, data modelling and advanced DAX, and Tableau with parameters, maps and storytelling. Employers in Jalandhar ask for one or the other; you arrive knowing both.
Honest about what a fast track buys
We will tell you plainly whether the four-month or the six-month track fits your goal. A student sold the wrong length is a student who does not finish.
A placement cell that persists
ATS resume building, GitHub documentation, LinkedIn optimisation and mock interviews, then repeated drives with hiring partners across Jalandhar and Ludhiana.
What our students say
Real experiences from learners across Jalandhar and the districts around it.
“I came from B.Com and month one felt like an extension of what I already knew. The Excel dashboard got me part-time reporting work before the SQL had even finished.”
RKRamanpreet KaurMIS Executive · Jalandhar “Four months was exactly right for me — long enough to cover both Power BI and Tableau properly, short enough that I did not lose momentum.”
AJAakash JainAfter 12th Student · Nakodar “Month four got me the interview. Nobody else applying could show a real BRD and a sprint they had actually run in Jira.”
SGSukhmani GillJunior Business Analyst · Phagwara “I came from B.Com and month one felt like an extension of what I already knew. The Excel dashboard got me part-time reporting work before the SQL had even finished.”
RKRamanpreet KaurMIS Executive · Jalandhar “Four months was exactly right for me — long enough to cover both Power BI and Tableau properly, short enough that I did not lose momentum.”
AJAakash JainAfter 12th Student · Nakodar “Month four got me the interview. Nobody else applying could show a real BRD and a sprint they had actually run in Jira.”
SGSukhmani GillJunior Business Analyst · Phagwara
“The DAX and star schema work is the difference between a chart and a model. My interviewer spent the whole round on my Power BI file.”
VKVarun KhannaBI Developer · Ludhiana “Knowing both BI tools mattered more than I expected — the firm that hired me had standardised on Tableau, not Power BI.”
NSNeetu SharmaReporting Analyst · Kapurthala “The AI module is genuinely useful. Writing SQL and report drafts with prompts saves me hours every week at work now.”
GSGaurav SondhiAfter 12th Student · Hoshiarpur “The DAX and star schema work is the difference between a chart and a model. My interviewer spent the whole round on my Power BI file.”
VKVarun KhannaBI Developer · Ludhiana “Knowing both BI tools mattered more than I expected — the firm that hired me had standardised on Tableau, not Power BI.”
NSNeetu SharmaReporting Analyst · Kapurthala “The AI module is genuinely useful. Writing SQL and report drafts with prompts saves me hours every week at work now.”
GSGaurav SondhiAfter 12th Student · Hoshiarpur
Frequently asked questions
Find answers to the questions students ask before enrolling.
Four months, covering 16 modules: programming and data analytics foundations; advanced SQL, data manipulation and visualisation; business intelligence and modern data platforms; then business analysis, AI productivity and the capstone. Weekday, evening and weekend batches cover the same syllabus, and 1-on-1 training is available. Every class runs for 2 hours.
Yes — that is who it is written for. Module 01 is the analytics lifecycle and setting up your tools, module 02 is Excel, module 03 is SQL, and Python only starts in module 04. The ramp is deliberate: you learn what you are automating before you learn to automate it.
No, and commerce students often do particularly well here. Nothing requires school physics or higher mathematics; the business statistics in module 04 are taught at the depth business reporting actually needs.
Both cover analytics and business analysis, but the six-month certificate has more room: a lab every single week across 24 weeks, six mini projects rather than one capstone, business statistics as its own dedicated week, BPMN process mapping in Lucidchart and Figma, Apache Airflow, machine learning for analysts, and a full placement preparation month. This four-month track compresses to the essentials and reaches the capstone sooner.
Both, deliberately. Months one to three are analytics and BI; month four carries requirement gathering, stakeholder and gap analysis, BRD, FRD and SRS documentation, and Agile and Scrum with user stories and sprint planning in Jira. It is why graduates can apply for either title.
Every module produces something a trainer reviews, and six are substantial portfolio pieces: an interactive Excel dashboard, an enterprise SQL reporting set, an EDA and business trend analysis, an interactive Streamlit analytics app, an executive Power BI and Tableau dashboard, and the enterprise analytics capstone.
Python with NumPy and Pandas; Microsoft Excel and Power Query; SQL on MySQL and PostgreSQL; Matplotlib, Seaborn, Plotly and Streamlit; BeautifulSoup and REST APIs; Power BI with DAX and Tableau; BRD/FRD, Jira, Confluence and Agile/Scrum; Microsoft Fabric, Snowflake and dbt; and ChatGPT, GitHub Copilot, Gemini and Claude for prompt engineering and automated reporting.
In Jalandhar, shorter fast-track programmes typically cost less than the six-month certificate tracks, which run in the ₹18,000 to ₹40,000 range. techcadd counsellors share the current fee sheet and EMI options on request, and a demo class is free.
Module 16 covers GitHub documentation, ATS resume building, LinkedIn optimisation and mock interviews alongside the capstone, and techcadd's placement cell runs drives with hiring partners across Jalandhar and Ludhiana.
No institute can honestly guarantee a job, and you should be cautious of any in Jalandhar that does. techcadd guarantees placement support: resume and portfolio guidance, mock interviews and repeated drives with hiring partners, continued after a rejection rather than abandoned.
Yes — a course completion certificate, plus a documented internship letter based on live work. Alongside them you leave with a GitHub portfolio and a defended enterprise capstone, which is what an interviewer actually opens.
Yes. techcadd Jalandhar runs weekday, evening and weekend batches in parallel so college students and working people can both attend, and 1-on-1 training is available for a fully personal schedule. Every class runs for 2 hours; book a free demo class to see the lab and meet the trainer before enrolling.
Ask about Data Analytics Program
Send your question and a counsellor will call you back about batch timings, fees, EMI options, placement record, or whether this course fits your degree.
- info@techcadd.com
- Phone
- +91 98881 22254
- Address
- 2nd Floor, Crystal Plaza, SCS 78, Opposite PIMS Hospital, Jalandhar, Punjab 144001
- Counselling hours
- Monday – Saturday, 9:00 AM – 7:00 PM
Not sure if Data Analytics Program is the right fit?
One call with a counsellor is usually enough to find out. Book a free demo class and see the lab before you decide.