Tableau Certificate Program in Jalandhar
Learn visual analytics for people who need to explain numbers, not just calculate them, taught on live client work at techcadd Jalandhar rather than from slides.
- Live client projects
- Practitioner trainers
- Placement support
- Certificate + internship
- Duration
- 3 – 6 Months
- Mode
- Classroom, Weekend & 1-on-1
- Eligibility
- 12th Pass Onward
- Includes
- Internship Letter
- Students trained
- 25,000+Students trainedsince 2016
- Google rating
- 4.9★Google rating556+ reviews
- Practical training
- 100%Practical traininglive client work
Course overview
techcadd's Tableau Certificate Program in Jalandhar runs 3 to 6 months for analysts and graduates who want visualisation skills that hold up in a consultancy or a corporate back office. It begins with Tableau Desktop and connecting to data, then dimensions, measures and how aggregation actually behaves, which is where most early mistakes happen, before moving into calculated fields and table calculations, then parameters, sets and filters for reports people can explore themselves. Dashboard and story design get a full module, along with maps and geographic analysis, and later sessions cover performance tuning for large data and publishing to Tableau Server, with Tableau Prep for cleaning and Tableau Public for a portfolio you can share. You work on real datasets sourced through SQL and Excel, and a trainer reviews both your design choices and your calculations, not just the finished chart. The program ends with a published dashboard portfolio, and CV and interview preparation for Tableau Developer or BI Analyst roles.
Numbers peoplecan actually see
Tableau is a visual analytics tool. You connect it to data, such as an Excel file or a SQL database, and build interactive charts, maps and dashboards by dragging fields onto a canvas. Its strength is helping people explore data and explain it clearly, not just calculate totals.
Think of the difference between a 40-page printed report and a good map app: the report has every number but nobody reads it, while the map shows you where to go at a glance. Tableau turns business data into that kind of picture. Analysts, consultants and managers in many departments use it the same way; only the data and the audience change. Each card below shows how much of that work this course covers.
- Job-ready focus2 fields
- The course trains you for entry-level work in this field.
- Strong foundation2 fields
- You learn the base skills here; one specialised course makes you job-ready.
- Introduced1 field
- You will use it in the course, but it is not a specialisation.
- Not covered1 field
- Not part of this course; available as a separate techcadd course.
What this course makes you job-ready for
Job-ready focusTableau Development
Building complete Tableau dashboards: connecting data, writing calculated fields, adding filters and parameters, and publishing the result for others to use.
A dashboard for a Jalandhar hand-tools exporter where the sales head picks a country and a year and immediately sees orders, margins and top buyers.
- Tableau tools used
- Tableau DesktopTableau ServerTableau Public
- Job roles
- Tableau DeveloperBI Developer
Foundations (data connections, dimensions and measures, calculated fields and table calculations), Core Skills (parameters, sets and filters) and Applied Work (publishing to Tableau Server). Projects: Tableau Fundamentals Build, Real-World Data Challenge.
Data Visualisation & Storytelling
Choosing the right chart and sequencing dashboards into a story so a non-technical audience understands the point without someone explaining every number.
A five-step Tableau story for a hospital board showing how waiting times changed after a new appointment system.
- Tableau tools used
- Tableau DesktopTableau Public
- Job roles
- Visualisation SpecialistBI AnalystData Analyst
Core Skills: dashboard and story design, with a trainer reviewing your design choices as well as your calculations.
What this course lays the foundation for
Strong foundationLocation & Map Analysis
Plotting data on maps to see where things happen: which districts buy most, where deliveries are late, how customers are spread across a city.
Mapping a Punjab FMCG distributor's sales by district to see which areas need more retailers.
- Tableau tools used
- Tableau Desktopgeographic data
- Job roles
- BI AnalystData Analyst
Core Skills: maps and geographic analysis. Enough for business map dashboards; dedicated GIS work is a separate field.
Data Analytics
Answering business questions with data: why sales fell, which product is growing, where costs are leaking. Tableau is one of the analyst's main tools, alongside Excel and SQL.
Finding that a retailer's weekend sales dropped only in two stores after a price change.
- Tableau tools used
- TableauExcelSQLstatistics
- Job roles
- Data AnalystBI Analyst
You work with real datasets sourced through SQL and Excel throughout. Writing SQL queries from scratch, business statistics and Power BI are taught in techcadd's Data Analytics course.
What this course introduces
IntroducedData Preparation
Cleaning and reshaping messy data before it is visualised: fixing formats, joining files and removing duplicates.
Combining monthly branch files with slightly different column names into one clean dataset for a dashboard.
- Tableau tools used
- Tableau PrepExcelSQL
- Job roles
- Data AnalystBI Developer
Tableau Prep is used for cleaning alongside the main modules, and performance tuning for large data is covered in Applied Work. Full data engineering is not part of this course.
Not part of this course
Not coveredData Science & Machine Learning
Predicting what is likely to happen next using Python, statistics and machine learning, rather than showing what already happened.
Forecasting which customers are likely to stop ordering next quarter.
- Tableau tools used
- Pythonpandasscikit-learn
- Job roles
- Data ScientistML Engineer
Not part of this course. Data science teams often present results in Tableau, so the skill stays useful if you move on to techcadd's Data Science course.
Clearing up common confusions
Is Tableau enough to become a Data Analyst?
It covers the visualisation half of the job well. Many Data Analyst job ads also expect SQL queries, Excel analysis and often Power BI. If those are new to you, the Data Analytics course adds them; if you already have them, Tableau is often what sets your CV apart.
Tableau is also used in…
Analytics consultancies, multinational back offices, finance and banking, healthcare, education, sports analytics and journalism. Power BI, Python and machine learning are not part of this course, but the dashboard and storytelling skills you learn here transfer directly to them.
At a glance: what this course covers
| Field | Coverage in this course | Where you learn it | Next step at techcadd |
|---|---|---|---|
| Tableau development | Job-ready focus | Foundations to Applied Work; Fundamentals Build | Ready to apply |
| Visualisation & storytelling | Job-ready focus | Core Skills; Real-World Data Challenge | Ready to apply |
| Location & map analysis | Strong foundation | Core Skills | Ready to apply |
| Data analytics | Strong foundation | All modules | Data Analytics course for SQL and statistics |
| Data preparation | Introduced | Tableau Prep, Applied Work | — |
| Power BI | Not covered | — | Power BI course |
| Data science & ML | Not covered | — | Data Science course |
Which Tableau pathsuits you?
Every Tableau role uses the same core: correct calculations and dashboards people can explore on their own. Most students find their direction while building real dashboards. If you already have an idea, this guide helps:
| If you… | You will probably enjoy | Typical first job |
|---|---|---|
| Enjoy design and making information easy to understand | Visualisation & storytelling | Visualisation Specialist |
| Like logic, formulas and getting the numbers exactly right | Calculated fields and Tableau development | Tableau Developer |
| Like business questions and presenting to managers | Analytics with Tableau | BI Analyst, Data Analyst |
| Want to work in a consultancy or multinational back office | Tableau development | Tableau Developer, BI Analyst |
| Want a public portfolio to show employers or clients | Tableau Public dashboards | Freelance Tableau Developer |
| Are not sure yet | Start with this course | Decide with your trainer once you have published your first dashboards |

Industry-Ready Training in Tableau
- 100% practical, project-based learning
- AI tools integrated into every module
- Live client projects under trainer supervision
- Internship letter and placement support
- Small batches with daily doubt clearing
What you will
actually build
The syllabus is arranged so every module produces an asset rather than a set of notes. You will cover tableau desktop and data connections, dimensions, measures and aggregation, calculated fields and table calculations, parameters, sets and filters, dashboard and story design, and finish with a live project built on Tableau Desktop, Tableau Public, SQL. Modules run in the order a real project runs: foundations first, then the core skills, then applied work under supervision, then the portfolio and interview preparation that turn all of it into an offer letter.
Foundations
- Tableau Desktop and data connections
Connecting Tableau Desktop live or extracted to SQL and Excel sources, and understanding which connection type a report actually needs before building anything on top of it.
- Dimensions, measures and aggregation
Telling Tableau's blue-and-green split apart and controlling how it aggregates a measure — sum, average or count — since a wrong default here quietly wrecks a chart.
- Calculated fields and table calculations
Writing calculated fields for custom logic and table calculations for running totals, percent-of-total and rank, the two calculation types that behave differently and trip up most beginners.
Useful for: Every Tableau role, especially Tableau Developer (calculations and aggregation).
Tableau Is Powering the Next Generation of Industry Leaders
- Live client work from week one, supervised by a trainer, not slides, not simulations.
- Tableau Developer roles in Punjab start around ₹16,000 – ₹30,000 a month for a fresher with a working portfolio.
Reviewed by mentors. Built for interviews.Who can dothis course
The Tableau programme is built for people at six different starting points, and the batch is deliberately mixed. What matters far more than your background is turning up consistently and finishing what each module asks you to build.
Students after 12th
Join from any stream. You start from fundamentals with no assumed knowledge, and most students run the programme alongside a degree at a Jalandhar college using the weekday or weekend batch.
Graduates and final-year students
If you are finishing a BA, BBA, B.Com, BCA or B.Tech, this is the shortest route from degree to salary. Enter placement season with project work in hand instead of a blank CV.
Working professionals
The weekend batch exists for people already earning. Career switchers typically become interview-ready for Tableau Developer roles within five to six months without leaving their current job.
Business owners and freelancers
Owners take this programme to stop outsourcing work they cannot judge. Freelancers take it to bill clients beyond Punjab, since location does not limit remote work in this field.
Career restarters
A gap on the CV counts for less than work you can point at. The programme starts at zero and finishes with a portfolio and a documented internship letter, which is what an interviewer asks about after a break.
Self-taught learners
If free videos left you with notes but nothing built, what changes here is a trainer who reviews what you produced this week and a deadline attached to every module.
One course.A mesh of real tools.
Everything below is installed on the lab machines and used on live client work, not shown once in a slide and forgotten.
- Tableau Desktop
- Where you connect data and build charts and dashboards
- Tableau Public
- A free site for publishing a dashboard portfolio anyone can open
- SQL
- Pulls business data from databases into Tableau
- Excel
- The most common data source, and a quick place to check numbers
- Tableau Prep
- Cleans and reshapes messy data before it reaches a dashboard
Get Certified in
Tableau
Complete the course with a portfolio of live projects and receive an industry-recognised certificate, plus a documented internship letter accepted by Punjab universities.
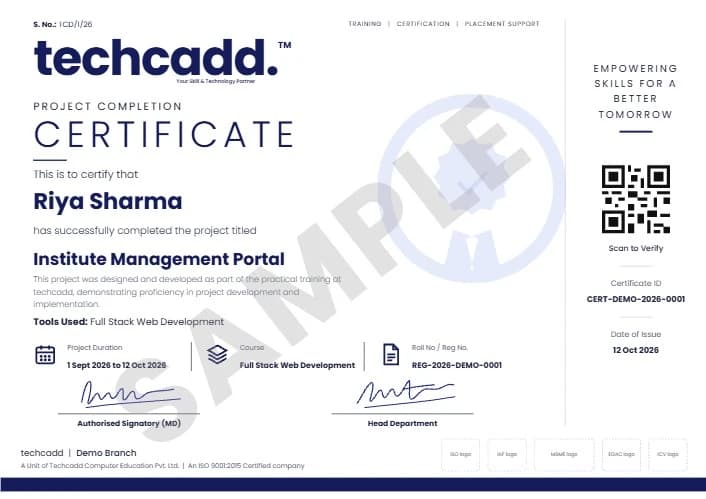
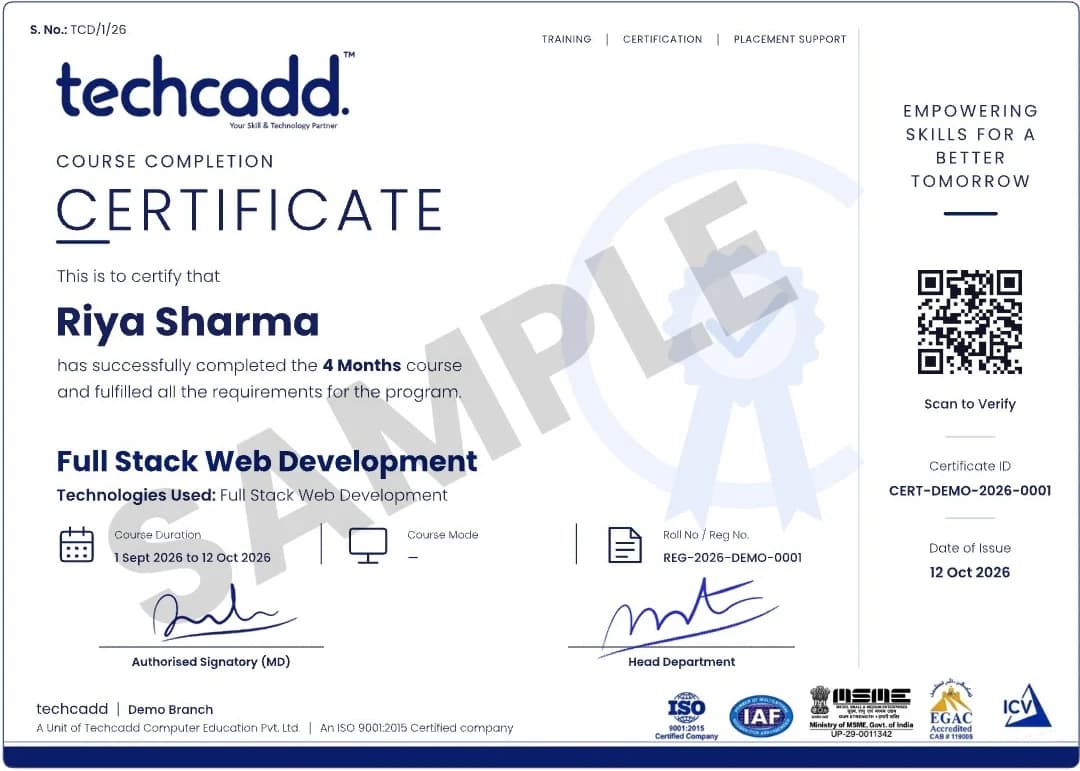
Two certificates on completion — the course certificate and a separate capstone project certificate.
Where this coursetakes you
The roles this opens, what they pay in Punjab and beyond, and who is hiring for them — the same figures our free Salary Estimator publishes, not a brochure number.
What job roles open up after Tableau?
Tableau is common in analytics consultancies and multinational back offices, and in any team that has to explain numbers to people who are not analysts. The roles fall into two groups:
- Tableau Developer
- BI Analyst
- Visualisation Specialist
- Data Analyst (visualisation-focused)
- Freelance Tableau Developer
- Data Analyst, full profile (with Data Analytics course)
- BI Developer across tools (with Power BI course)
- Data Scientist (with Data Science course)
What job roles open up after Tableau?
Graduates move into Tableau Developer, Data Analyst, BI Analyst, Visualisation Specialist and similar roles. Tableau is common in analytics consultancies and multinational back offices around Jalandhar.
What can I earn, and how fast does it grow?
A fresher with a working portfolio starts around ₹16,000 – ₹30,000 a month in the Jalandhar market. With two years of delivery experience that typically doubles, and specialists who keep learning move well beyond it.
Can I freelance or work remotely with this skill?
Yes. A Jalandhar address costs you nothing on a remote brief. Students bill clients in Delhi, Dubai and Canada. The programme covers client handling, proposals and reporting so you can price and defend your work, not just do it.
Which industries hire for this in Punjab?
Beyond IT companies, the export houses, sports goods and hand tool manufacturers, immigration consultancies, hospitals, schools and real estate firms across Jalandhar all now hire for these skills directly.
Can I continue to higher studies or a specialisation later?
The certificate and portfolio stand on their own, and they stack. Most students move on to an adjacent techcadd track. The tools overlap, so the second programme is faster than the first.
Your Tableau careerroadmap
For Tableau and visualisation roles this course is enough on its own. For broader analyst or data science roles, you add one focused course. Here is how each path looks:
| Goal | Step 1 | Step 2 | Where you arrive |
|---|---|---|---|
| Tableau Developer | Tableau Certificate Program | Ready to apply | Tableau Developer |
| Visualisation Specialist | Tableau Certificate Program | Ready to apply | Visualisation Specialist |
| Data Analyst | Tableau Certificate Program | Data Analytics (Excel, SQL, statistics, Power BI) | Data Analyst |
| BI Developer (multi-tool) | Tableau Certificate Program | BI Developer | |
| Data Scientist | Tableau Certificate Program | Data Scientist |
Hands-on projectsyou will ship
Tableau Fundamentals Build
Your first working piece, applying tableau desktop and data connections and dimensions, measures and aggregation end to end rather than as isolated exercises.
Field: Tableau Development
Real-World Data Challenge
Work with messy, real inputs (parameters, sets and filters and dashboard and story design) and defend the choices you made to a trainer.
Field: Visualisation & Storytelling
Live Client Brief
A genuine requirement from techcadd's delivery pipeline, scoped, built and shipped under supervision. This is the one interviewers ask about.
Field: Business Intelligence (client work)
Portfolio Capstone
A tableau project you specify yourself, covering performance tuning for large data and deployment, and present as your final piece.
Field: Tableau Development, Data Preparation
Learn it. Build it. Make it yours.
Every project moves through the same loop: understand the brief, build with guidance, then explain the decisions behind your work.
Understand
Break a real requirement into a clear plan and the right tools.
Tableau Fundamentals BuildBuild
Work hands-on with trainer feedback while the decisions are still easy to change.
Real-World Data ChallengePresent
Turn the finished work into a portfolio story you can defend in an interview.
Live Client BriefWhy students choosetechcadd
There are many places to learn this in Jalandhar and the brochure syllabus looks similar at all of them. What differs is who teaches, whether you ever touch real work, and whether anyone picks up the phone after you have paid. techcadd has trained students across Punjab since 2016 on the same model: small batches, working practitioners as trainers, client projects as coursework.
Trainers who still do the work
Your trainer is not a full-time lecturer. They deliver client projects for techcadd's services arm, so examples in class are current rather than a case study from five years ago.
Live projects, real consequences
You work on genuine client requirements under supervision. This is where a portfolio comes from, and it is the first thing an interviewer asks to see.
Small batches and open lab hours
Batches stay small enough that a trainer sees your screen daily. Lab time runs outside class hours and doubt sessions continue until the concept lands.
Internship letter and certificate
Every student finishes with an industry-recognised certificate and a documented internship on real work, accepted for university industrial training requirements.
A placement cell that persists
Mock interviews, CV reviews and drives with hiring partners across Jalandhar and Ludhiana, repeated after a rejection, not abandoned.
Since 2016, 25,000+ students
A decade of hiring relationships in Punjab is why a call from our placement cell gets answered and why local employers know what our certificate means.
How techcaddcompares
BI programmes are sold on dashboard screenshots. These are the eight things worth asking before you pay any institute, including this one.
| Feature | techcadd | Other institutes |
|---|---|---|
| Curriculum | Industry-aligned, updated regularly | Often outdated or generic |
| Learning style | 100% hands-on, project-based | Mostly theory-heavy |
| Trainers | Industry-experienced mentors who still deliver client work | Mixed experience levels |
| Real projects | Multiple real-world projects plus a capstone | Limited or simulated projects |
| Data you work on | Messy real business data you model yourself, ending in a dashboard you publish and defend | Pre-cleaned sample files |
| Placement support | Dedicated career and interview preparation | Often limited or absent |
| Batch flexibility | Weekday, evening, weekend and 1-on-1 options | Fixed schedules |
| Doubt support | Ongoing mentor and community support | Limited post-class support |
| Certification | Industry-recognised certificate plus a documented internship letter | Varies |
The right-hand column describes what is commonly offered in the market, not any particular institute. Ask any institute you are considering — this one included — to show you the work its students actually produced.
What our studentsin Jalandhar say
- Google
techcadd's placement cell kept calling me for drives until I was placed. That persistence mattered more than the certificate for Tableau.
Pooja RaniGraduate · Kartarpur GoogleI was switching careers and worried I would be behind. Half the Tableau batch were doing the same thing, and nobody made me feel slow.
Karan MehtaB.Tech Student · Jalandhar GoogleI joined the Tableau batch with almost no background and finished with a project I could actually show. The trainers correct your work daily rather than just moving to the next slide.
Sandeep KaurPlaced Fresher · Phillaur Googletechcadd's placement cell kept calling me for drives until I was placed. That persistence mattered more than the certificate for Tableau.
Pooja RaniGraduate · Kartarpur GoogleI was switching careers and worried I would be behind. Half the Tableau batch were doing the same thing, and nobody made me feel slow.
Karan MehtaB.Tech Student · Jalandhar GoogleI joined the Tableau batch with almost no background and finished with a project I could actually show. The trainers correct your work daily rather than just moving to the next slide.
Sandeep KaurPlaced Fresher · Phillaur
- Google
What made Tableau click for me was the lab time. You can sit after class and someone will still explain it until you get it.
Harpreet KaurSoftware Trainee · Jalandhar GoogleThe Tableau programme got me interview-ready faster than I expected. My interviewer asked to see my project and that was the whole conversation.
Rohit SharmaJunior Analyst · Phagwara GoogleI travelled in for the weekend Tableau batch and it was worth every trip. Small batch, real work, no time wasted on theory nobody uses.
Simranjeet SinghFreelancer · Kapurthala GoogleWhat made Tableau click for me was the lab time. You can sit after class and someone will still explain it until you get it.
Harpreet KaurSoftware Trainee · Jalandhar GoogleThe Tableau programme got me interview-ready faster than I expected. My interviewer asked to see my project and that was the whole conversation.
Rohit SharmaJunior Analyst · Phagwara GoogleI travelled in for the weekend Tableau batch and it was worth every trip. Small batch, real work, no time wasted on theory nobody uses.
Simranjeet SinghFreelancer · Kapurthala
Frequently Asked Questions
techcadd runs Tableau over 3 to 6 months depending on the track you choose. Weekday, evening and weekend batches cover the same syllabus, and 1-on-1 training is available if you would rather set your own pace. Every class runs for 2 hours, whichever format you choose.
Fees depend on the course length and subject. techcadd counsellors share the exact fee for the length you choose and EMI options on request, and a demo class is free.
Students after 12th, graduates and final-year students, working professionals switching careers, and business owners all join this programme. You start from fundamentals, so a technical background helps but is not required.
Graduates typically move into roles such as Tableau Developer, Data Analyst, BI Analyst or Visualisation Specialist. Tableau is common in analytics consultancies and multinational back offices around Jalandhar.
A fresher with a working portfolio typically starts around ₹16,000 – ₹30,000 per month in the Jalandhar market, rising substantially within two years of experience. Freelancers handling multiple clients often earn more, since remote work is not limited by location.
No training provider can honestly guarantee a job, and you should be cautious of anyone in Jalandhar who claims one. techcadd guarantees placement support: CV reviews, mock interviews, portfolio preparation and repeated drives with hiring partners across Jalandhar and Ludhiana.
You will work hands-on with Tableau Desktop, Tableau Public, SQL, Excel, Tableau Prep and the supporting toolchain used on live projects. All practice happens in the lab on licensed software, not on demo screenshots.
Yes. Every student receives an industry-recognised certificate on completion plus a documented internship letter based on live client work. The internship satisfies the industrial training requirement at most Punjab universities.
Every module ends with something you built. The Tableau Certificate Programme finishes with a live project drawn from techcadd's own client delivery work, supervised by a trainer, which becomes the portfolio you take to interviews.
Yes. techcadd Jalandhar runs weekday, evening and weekend batches in parallel so working professionals and college students can both attend, and 1-on-1 training is available for a fully personal schedule. Every class (batch or 1-on-1) runs for 2 hours; book a free demo class to see the lab and meet the trainer before enrolling.
If you mainly want local jobs in Jalandhar, Power BI is more common because most businesses here already run on Microsoft tools. If you are aiming at analytics consultancies or multinational back offices, Tableau is very common there. The core thinking is the same, so whichever you learn first makes the second much quicker.
It is enough for Tableau Developer, BI Analyst and visualisation roles. Many Data Analyst job ads also ask for SQL queries, Excel analysis and basic statistics, which this course uses but does not teach in depth. techcadd's Data Analytics course covers those alongside Power BI and Tableau.
No. Tableau is mostly drag-and-drop. Calculated fields and table calculations use a formula language similar to Excel formulas, and they are taught step by step. You use SQL and Excel as data sources, but you do not need to be a programmer.
Tableau Desktop is where you build dashboards. Tableau Public is a free website for sharing dashboards publicly, which makes it ideal for a portfolio employers can open. Tableau Server is where companies publish dashboards privately for their own staff. This course uses all three.
Every module,stage by stage
The Tableau syllabus runs as 3 stages inside one enrolment. A tick shows the stage each capability first appears in — the ladder is cumulative, so a later stage builds on the earlier ones instead of replacing them.
Foundations & Core Skills
6 capabilities
Opens with Tableau Desktop and data connections through Maps and geographic analysis. 6 capabilities, taught, practised in the lab and assessed on work you keep.
Applied Work
+2 capabilities
Adds Performance tuning for large data through Publishing to Tableau Server, on top of everything stage 1 already covers.
Live Project & Placement Prep
+4 capabilities
Adds A live client project you keep in your portfolio through Placement drives with our hiring partner network, on top of everything stage 2 already covers.
| Module | Stage 1 | Stage 2 | Stage 3 |
|---|---|---|---|
| 01Tableau Desktop and data connectionsTaught in the foundations stage, with a graded exercise you keep. | Included | Included | Included |
| 02Dimensions, measures and aggregationPart of foundations — practised in supervised lab time, not just demonstrated. | Included | Included | Included |
| 03Calculated fields and table calculationsBuilt hands-on in the foundations stage and reviewed line by line. | Included | Included | Included |
| 04Parameters, sets and filtersCovered under core skills, with lab work you can show in an interview. | Included | Included | Included |
| 05Dashboard and story designAssessed on what you produce in the core skills stage, not on notes. | Included | Included | Included |
| 06Maps and geographic analysisWorked through in the core skills stage and carried into your project. | Included | Included | Included |
| 07Performance tuning for large dataTaught in the applied work stage, with a graded exercise you keep. | Not included | Included | Included |
| 08Publishing to Tableau ServerPart of applied work — practised in supervised lab time, not just demonstrated. | Not included | Included | Included |
| 09A live client project you keep in your portfolioBuilt hands-on in the live project & placement prep stage and reviewed line by line. | Not included | Not included | Included |
| 10Documented internship on real workCovered under live project & placement prep, with lab work you can show in an interview. | Not included | Not included | Included |
| 11CV review, mock interviews and aptitude drillsAssessed on what you produce in the live project & placement prep stage, not on notes. | Not included | Not included | Included |
| 12Placement drives with our hiring partner networkWorked through in the live project & placement prep stage and carried into your project. | Not included | Not included | Included |
Every stage sits inside the one programme: nothing is dropped as you move up, and nothing is charged for twice. If you are not sure which stage matters most for the role you are aiming at, a counsellor will map it against the jobs actually hiring in Punjab right now.
Not sure which Tableau path is right for you?
One call with a counsellor is usually enough. Tell us your background and where you want to work, and we will show you whether Tableau, Power BI or the full Data Analytics programme is the better fit. Book a free demo class and see the lab before you decide.
Ask aboutTableau
Send your question and a counsellor will call you back about batch timings, fees, EMI options, placement record, or whether this course fits your degree.
- Free counselling and demo class
- Weekday, evening, weekend or 1-on-1, all 2-hour classes
- Internship letter and placement support