Analytics is not just attractive charts
A polished dashboard can still mislead if the data is incomplete, a KPI is poorly defined or filters produce wrong totals. The goal is analytical judgement, not memorised software menus.
Make your final semester count. Turn spreadsheets and raw data into useful business answers with Excel, Google Sheets, SQL, Python, Power BI and Tableau — data cleaning, KPI reporting and practical dashboards through a structured six-month pathway — and check whether the format fits your university requirements.
Ask for the current fee, format, schedule, project supervision and certificate details in writing before enrolling.
Overview
Data analytics turns raw information into clear findings that support decisions. Business intelligence focuses on reliable metrics, reporting systems and dashboards that help teams understand performance. Six months gives you time to practise the whole process: ask a useful question, collect and check data, write SQL, clean records, model it for reporting, build visuals and explain what changed.
A workplace internship usually includes supervised responsibilities in an organisation; industrial training centres on instruction, lab work and guided projects. Both can be valuable, but they are not interchangeable — ask who supervises the work, what deliverables are required and which documents your university accepts.
A polished dashboard can still mislead if the data is incomplete, a KPI is poorly defined or filters produce wrong totals. The goal is analytical judgement, not memorised software menus.
Analysis explains why a number moved; BI makes sure the number is defined, refreshed and reported the same way every time.
Jalandhar students coordinate lab sessions with semester classes, examinations and final presentations. A nearby centre makes mentoring and project reviews easier to reach.
Compare mentor availability, project depth, feedback, assessment, timetable and clear administrative processes before choosing any six-month programme.
Who can apply
Whatever your degree, check eligibility, assessment standards, attendance rules, laptop or lab access and university permission before enrolling.
Connect database management, programming, statistics and software engineering subjects with SQL-based reporting, dashboard architecture and data validation.
Build from familiar computer applications topics toward spreadsheet analysis, SQL, Power BI, basic statistics and portfolio-ready reporting projects.
Explore more advanced reporting workflows, dimensional modelling, performance, documentation, governance and collaboration on analytics deliverables.
Apply programming and quantitative reasoning to real analytical questions, with emphasis on data quality and communicating findings.
Business analytics is especially relevant to finance, marketing, operations and sales reporting. Programming support may be needed for the SQL and Python modules.
Eligibility depends on starting skills, available time and academic requirements rather than a one-size-fits-all promise.
Why a six-month analytics path?
SQL joins, pandas groupings, DAX measures and business metrics take repeated practice before they feel natural. A semester gives each of them room.
A semester-long plan leaves time for debugging, review and improvement instead of rushing through demos.
A data dictionary, transformations, documented KPI definitions, an interactive dashboard and a concise explanation of what the numbers do and do not show.
Analysts explain results to people who may not know SQL or Power BI. Presentations and written summaries teach you to translate technical output into decisions.
Compare data analyst, BI analyst, reporting analyst, operations analyst and junior analytics roles before committing to a specialisation.
A structured project helps you practise reporting and viva presentations — but acceptance as compulsory industrial training depends on your college or university.
Tools & technologies
Nine tools, taught in the order an analyst uses them: spreadsheets first, then SQL and Python, then dashboards. Statistics, KPI design and data ethics run through every module. Ask for the module-by-module list for your batch.

Cleaning tables, formulas, lookup methods, pivot tables, charts, data validation, Power Query concepts and transparent spreadsheet models.
Shared, cloud-based spreadsheets: collaborative cleaning, formulas, pivot tables, QUERY and IMPORT functions, and reports that update for a whole team.
Variables, functions, files and notebooks — enough programming to automate repetitive reporting and make an analysis repeatable.
Arrays and vectorised calculations for fast numeric work, and the foundation that pandas is built on.
Loading, cleaning, joining, grouping and reshaping data, with data checks for missing values, duplicates and wrong types.

Line, bar, scatter and histogram charts with labelled axes, controlled scales and honest annotations.

Statistical visualisation — distributions, correlations, category comparisons and heatmaps — for exploratory analysis.
Filtering, joins, grouping, window functions, common table expressions, null handling, query logic and performance basics.

Data import, Power Query, relationships, star schemas, DAX measures, interactive visuals, drill-through and visual storytelling.
Syllabus & learning roadmap
Each month ends in a deliverable. A typical week holds one concept lesson, one guided lab, one independent exercise and one review — confirm contact hours and mentor arrangements for your batch.
Rows, columns, data types, missing values, duplicate records and descriptive measures. Formulas, pivots, conditional logic and clear chart design in Excel and Google Sheets. Deliverable: a spreadsheet performance summary with an audit sheet.
Tables, keys, joins, filtering, aggregation, subqueries, common table expressions and window functions — answering business questions and reconciling totals. Deliverable: a SQL case study with documented queries and checks.
Python basics, NumPy arrays, pandas cleaning and grouping, and exploratory charts in Matplotlib and Seaborn, alongside averages, variability and correlation. Deliverable: a reproducible notebook analysing a public dataset.
Power Query, relationships, star schemas, DAX measures and filter context; report design, drill-through, row-level security concepts and refresh. Deliverable: a multi-page management dashboard with a KPI glossary.
Choose a sales, finance, marketing, HR or operations question. Document assumptions, clean the data, build a model and review the metrics with a mentor. Deliverable: a project draft with a data dictionary and limitations.
Refine the project, test edge cases, document sources and present your findings. Practise explaining joins, pandas, DAX, data cleaning and KPI design. Deliverable: final report, dashboard demonstration and review notes.
Course vs internship vs industrial training
Engineering colleges use “industrial training”, “six-month training” and “internship” differently. Your university handbook, department coordinator and academic policy decide what counts — not the programme title.
Real-world analytics & BI projects
Certificates & deliverables
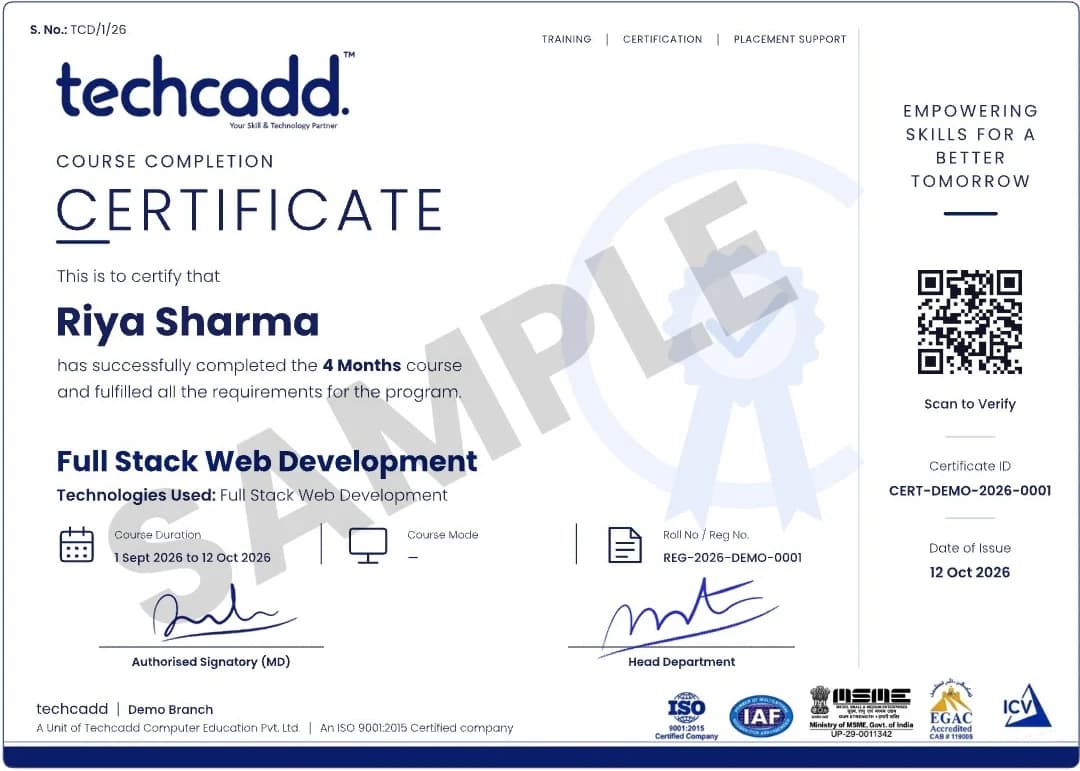
Issued on finishing the programme, with a QR code and certificate ID anyone can verify.
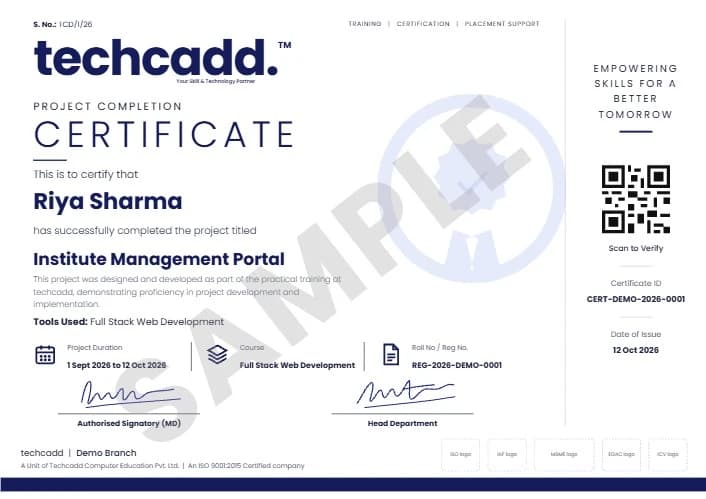
A separate certificate naming the live project you designed and built during training.
Project ideas
Each follows the same method: identify the audience and the decision they need to make, define every KPI, use public, synthetic or approved data, clean it before modelling, and finish with a dashboard walkthrough, a validation checklist and a short presentation.
Monthly sales, product categories, returns and region-level trends, built on a transparent KPI dictionary.
Course-wise outcomes from approved or synthetic data, without exposing any student's identity.
Stock turnover, ageing and reorder summaries from a sample inventory dataset.
Leads, conversion rates, channel cost and the attribution assumptions behind them.
Ticket volumes, resolution time, backlog and service-level indicators.
Aggregated attendance, team capacity and turnover, with privacy safeguards.
Planned and actual spending, variances and category-level explanations.
Funnel steps, order value, repeat purchases and the limits of missing event data.
Trends, peak loads and conservation opportunities from public meter datasets.
How to apply
Six steps, so you know what is confirmed in writing before you pay and what is assessed at the end.
Share your degree, semester, preferred start month and whether your university requires a specific type of placement.
Review prerequisites, curriculum, format, hours, fees, project expectations and documentation.
Receive current programme details, policies and any required approvals before registration.
Begin with Excel, Google Sheets and SQL, then Python and dashboard development, with regular exercises.
Select a suitable dataset and question, plan checkpoints and receive structured feedback.
Present the dashboard, explain your calculations and submit the report and portfolio materials.
University & college requirements
Ask your training and placement cell or department coordinator before paying, keep copies of written approvals, and ask techcadd to confirm which documents it can genuinely issue.
Requirements differ between universities and even departments. A practical checklist includes the department handbook, approval email, project scope, timetable, attendance method, evaluation rubric and final submission date. Do not assume an institute certificate alone satisfies a university internship requirement.
Duration, semester planning & batches
Six months can align with a final-semester calendar, but confirm the actual dates, weekly hours and holidays for your batch.
Plan around examinations, faculty reviews, report submission and commuting time.
Ask for the current intake month, batch format and seat availability rather than relying on an “admissions open” banner.
Guided labs are not enough on their own. Budget regular time each week for SQL, Python and dashboard practice.
Eligibility, fees & what is included
Ask for the real programme fee in writing and what it includes. Compare total cost and the quality of supervision, not a headline discount.
Basic computer skills help; no prior coding is assumed for the spreadsheet modules. The programming level needed for SQL and Python depends on the batch and the complexity of your project.
Career scope
Entry-level roles you might work towards — job titles, hiring criteria and salaries vary by employer:
A six-month programme does not guarantee employment; a credible portfolio and continuing practice support future applications.
Clean datasets, calculate KPIs, write queries and explain trends to the people who make decisions.
Build data models, DAX measures and repeatable management reports, and investigate inconsistencies when numbers disagree.
Apply the same skills to operations, marketing or finance — process efficiency, campaign performance, budgets and variances.
Why students consider techcadd
Ask about instructor experience, class size, practical lab time, access to current BI tools, project feedback and mentoring — and ask to see sample dashboards and student work published with permission.
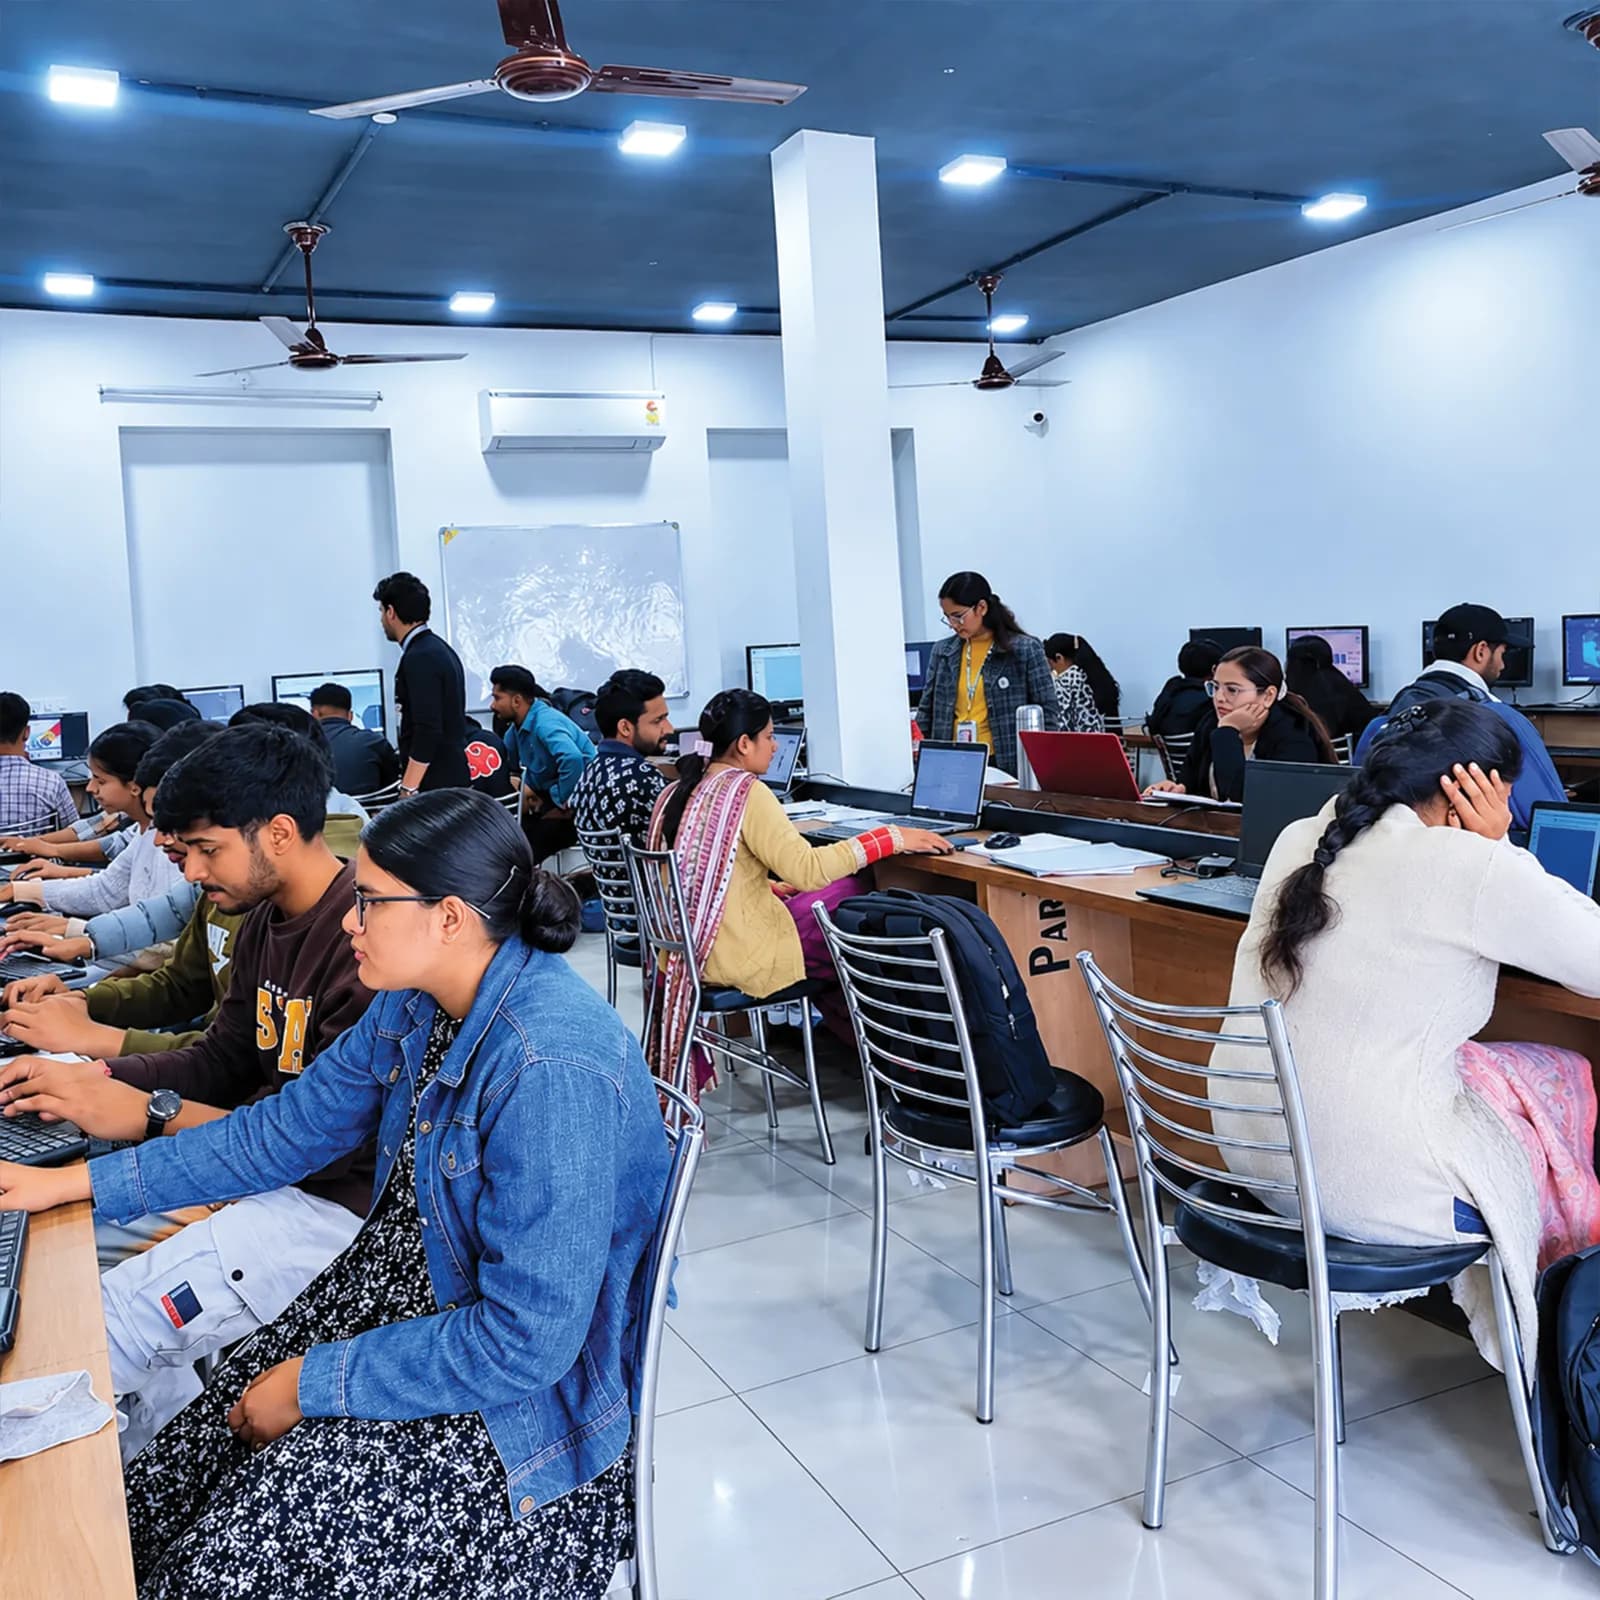
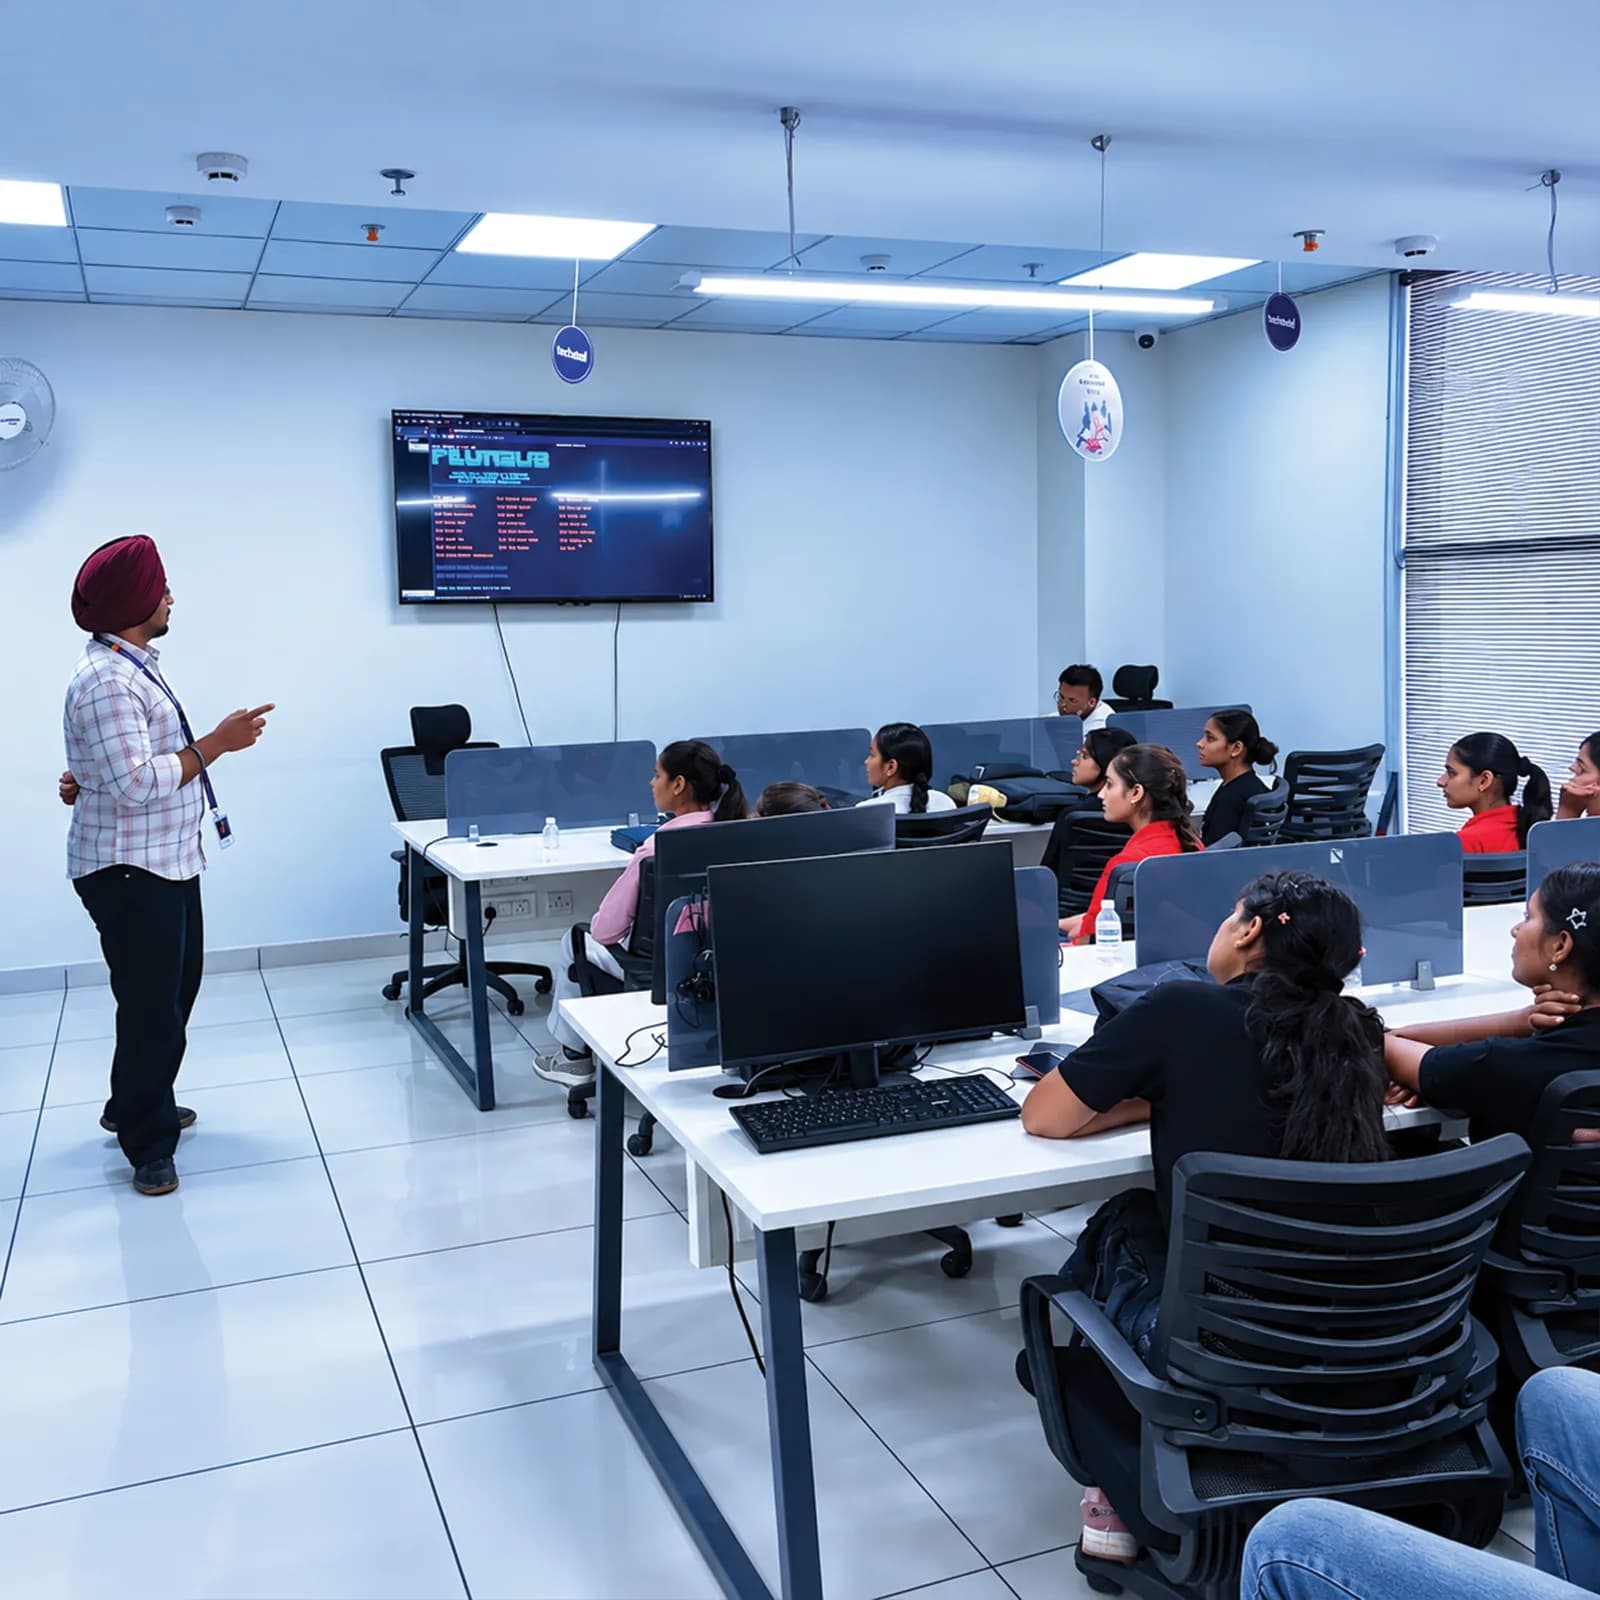
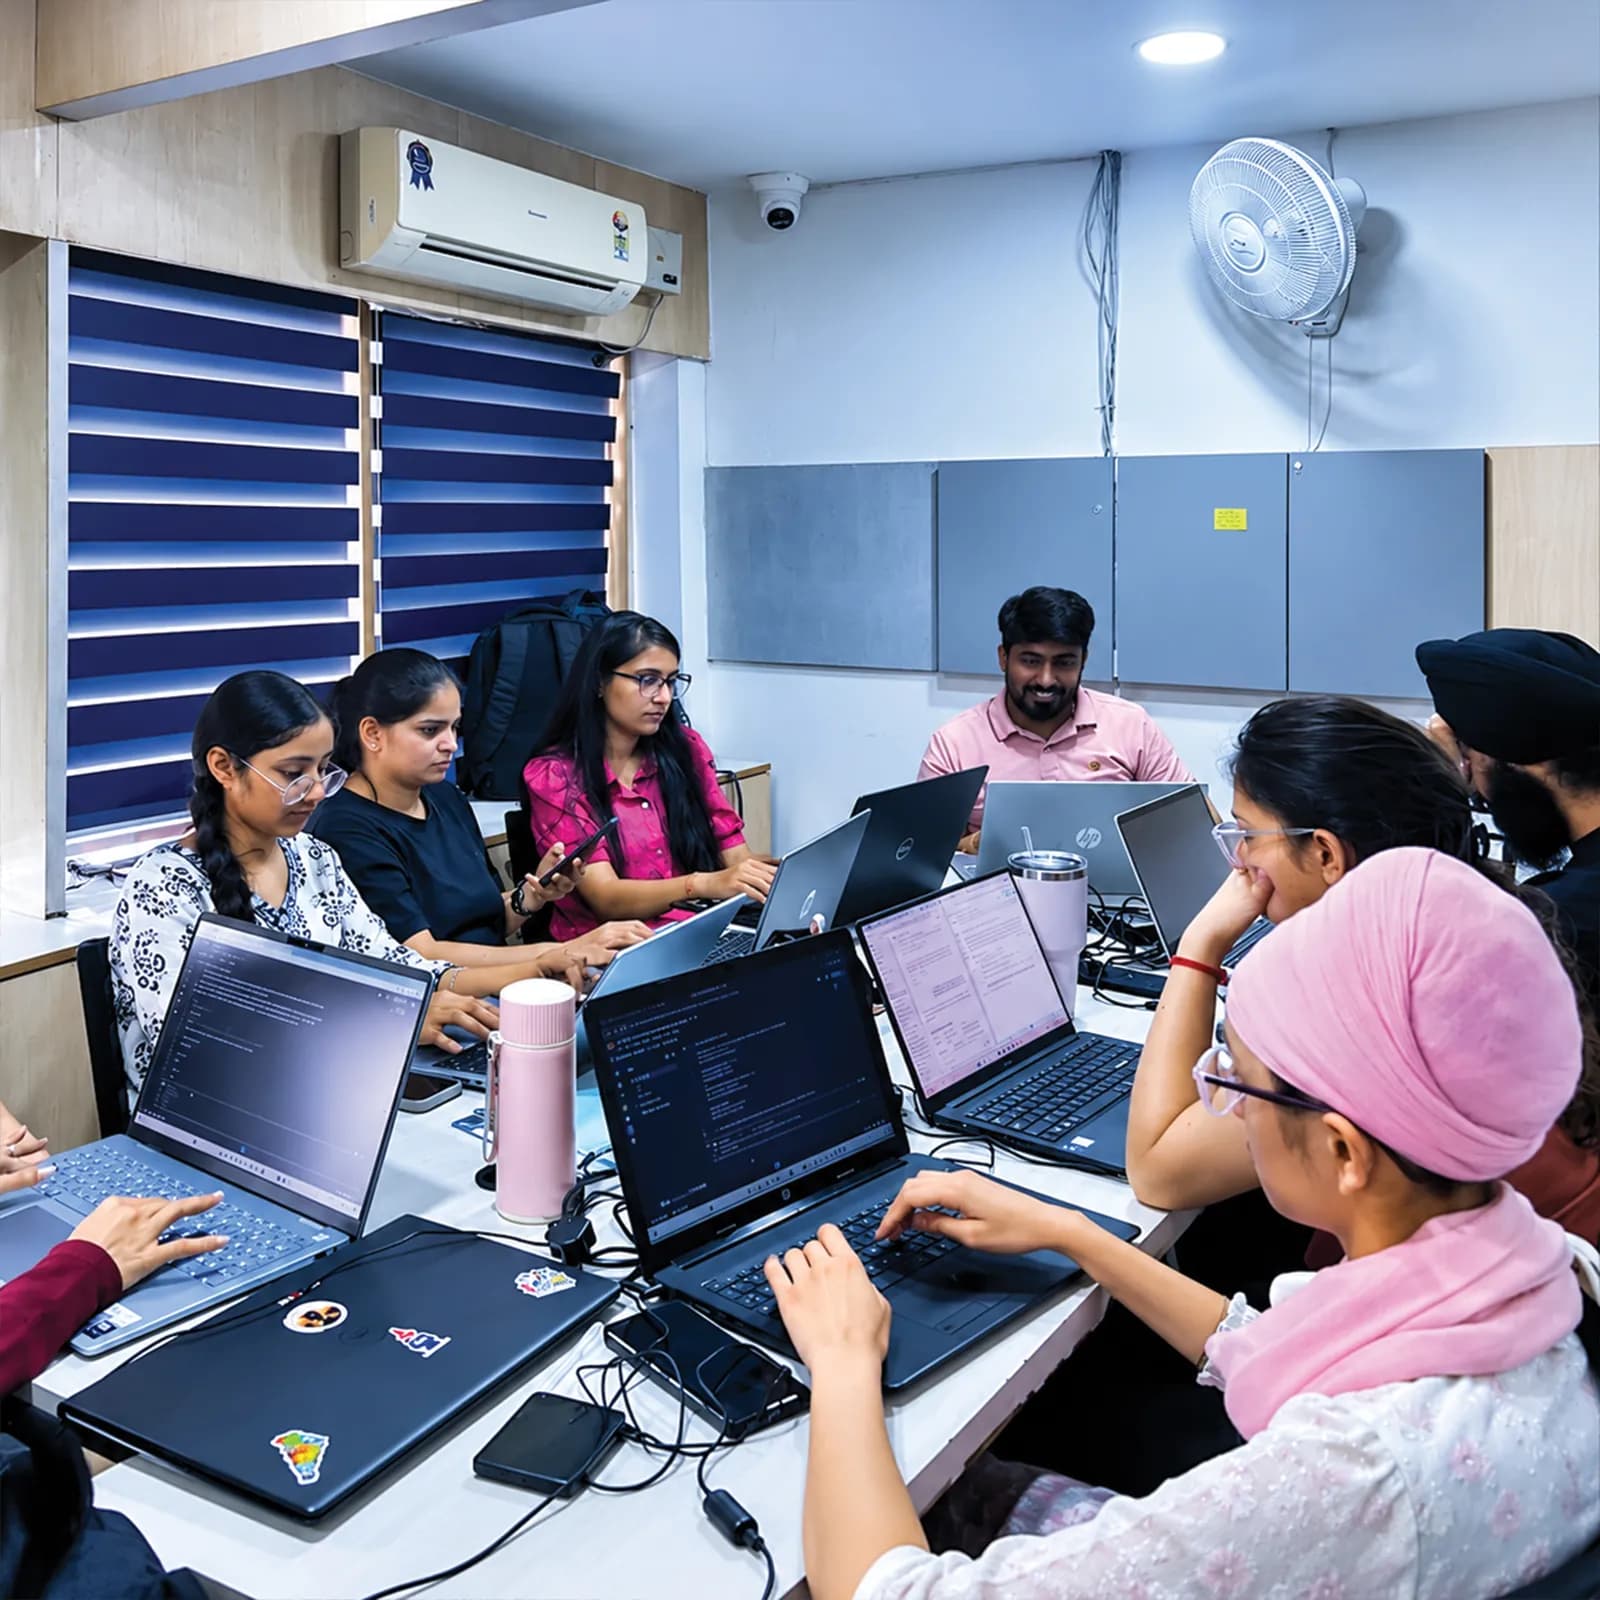
A deliverable at the end of every month, so you can see your progress and what is assessed.
Hands-on lab time in Excel, Google Sheets, SQL, Python, Power BI and Tableau.
Fees, documents, project expectations and how outcomes are assessed — explained before admission.
Visit the centre, meet the trainers and look at the labs before you confirm a batch.
The centre is at 2nd Floor, Crystal Plaza, SCS 78, Opposite PIMS Hospital, Jalandhar. Ask about the learning format, counselling hours and public transport before you join, and check your travel time against your college timetable.
techcadd Jalandhar — 2nd Floor, Crystal Plaza, SCS 78, Opposite PIMS Hospital, Jalandhar, Punjab 144001Frequently asked questions
Answers can differ by degree, semester and batch — confirm any academic requirement directly with your institution.
You can enquire about the current data analytics and BI programme at techcadd. Confirm whether it is a workplace internship or industrial training.
It may suit students who want applied database, reporting and analytics practice, subject to university requirements.
BCA students can often start with spreadsheets and SQL before dashboard modelling. Confirm the entry requirements.
A reporting or analytics capstone can be appropriate if it meets the department's academic rules.
Analytics emphasises describing and explaining data for decisions; data science may additionally focus on predictive modelling and experimentation.
Excel, Google Sheets, Python with NumPy, pandas, Matplotlib and Seaborn, SQL, and Power BI or Tableau. Ask for the module-by-module list for your batch.
Dashboard development is taught in Power BI or Tableau. Ask which one your batch uses before enrolling.
Not always — SQL, modelling and reporting are central to many BI roles. Python with pandas is useful for automation and deeper analysis, which is why it is part of this pathway.
Basic computer skills help. The programming level needed depends on the batch and project complexity.
Yes, many business questions suit analytics. Check the technical prerequisites and programme eligibility.
DAX is a formula language used for calculations in Power BI data models.
Only if actual supervised client work is available and appropriately authorised. Ask for written details.
Confirm the exact document issued, the conditions, and whether it reflects actual work or training.
Only your college or university can confirm recognition for its academic requirements.
Request the current fee sheet and ask which services and assessment charges are included.
No. Evaluate any career support separately, and don't treat training as a job guarantee.
Ask about lab availability and the recommended specification for independent practice.
Objectives, data sources, cleaning, model design, analysis, results, limitations and references.
Send an enquiry from this page or call +91 98881 22254, share your degree and semester, and request the verified syllabus and joining details.
techcadd Jalandhar is at 2nd Floor, Crystal Plaza, SCS 78, Opposite PIMS Hospital, Jalandhar, Punjab 144001. Visit for a counselling discussion before you confirm a batch.
Apply
Looking for a 6 months data analytics internship in Jalandhar, a Power BI industrial training programme or a final-semester BI project pathway? Tell us your degree, university requirements, preferred start month and learning goals, and request the syllabus, fee structure, project evaluation process and documentation before you enrol.